In Q1 2026, FPT Data Suite released a series of enhancements designed to help businesses analyze and visualize data faster and more effectively.
These updated features focus on three key objectives: reducing the time required to build reports, improving the experience of creating and viewing dashboards, and increasing system stability when handling large-scale datasets. Detailed updates can be found here.
Highlights of this release include Report Book, Pipeline Template, several new chart types, and various usability improvements that make data analysis more flexible and efficient.
Key Highlights of the Q1/2026 Update
1. Report Book
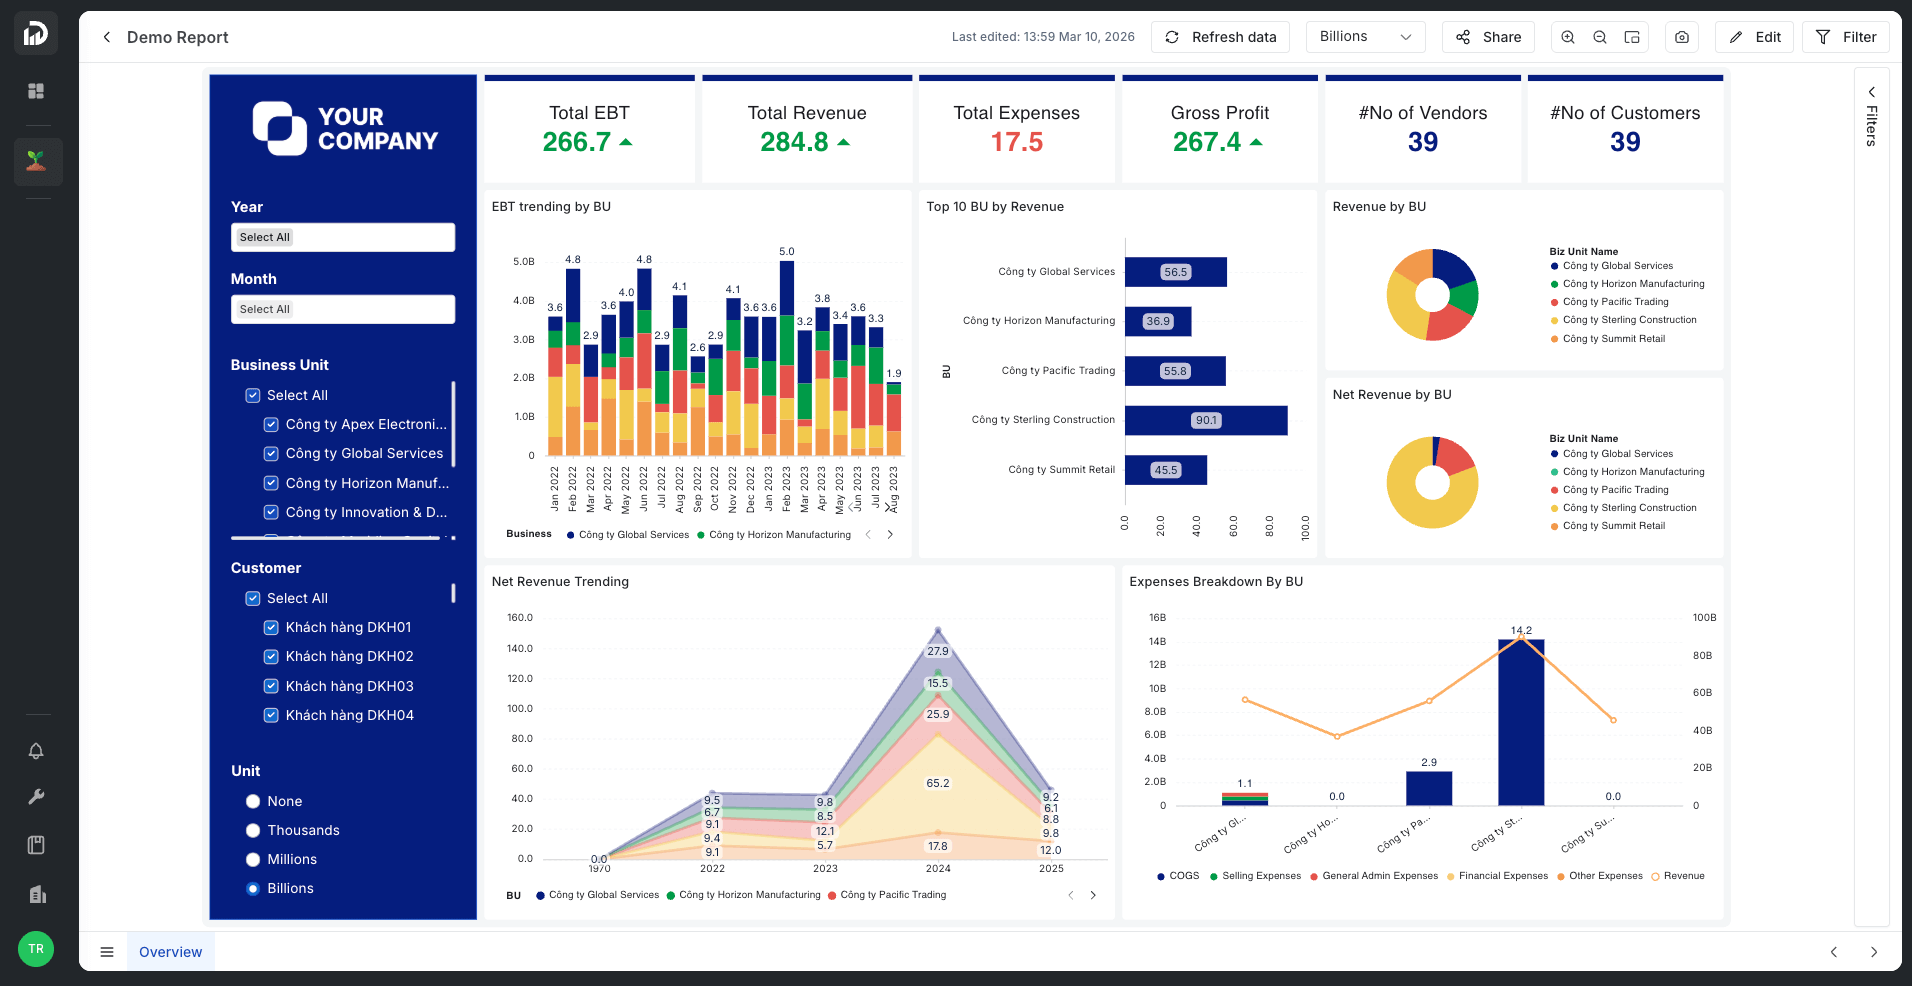
Report Book is one of the most notable features introduced in the Q1/2026 update. It allows users to group multiple individual reports into a single consolidated page based on business functions such as Sales, Accounting, Finance, and more. This makes it easier for managers to quickly locate related reports within a centralized interface.

Report Book also supports a dedicated permission mechanism, allowing access to be granted to individual users or user groups within a workspace. Authorized users can view all reports within a Report Book without requiring separate permissions for each individual report.

In addition, the Report Page feature integrated within each report allows users to create multiple sub-pages in a single report, providing a more organized reporting structure.
Learn more about Report Book HERE.
2. Pipeline Template – Accelerating Dashboard Development
Another key enhancement in this release is Pipeline Template. Previously, FPT Data Suite introduced Report Template, a library of pre-built sample reports designed for various business scenarios. These templates use sample data to demonstrate how dashboards can be structured and how insights can be presented.
With Pipeline Template, users can quickly create data pipelines to ingest and process data from source systems such as SaaS platforms or enterprise databases.
Once the data is ingested and processed, the system automatically replaces the sample data in the Report Template with real data, creating a seamless workflow from data connection → data processing → report visualization.
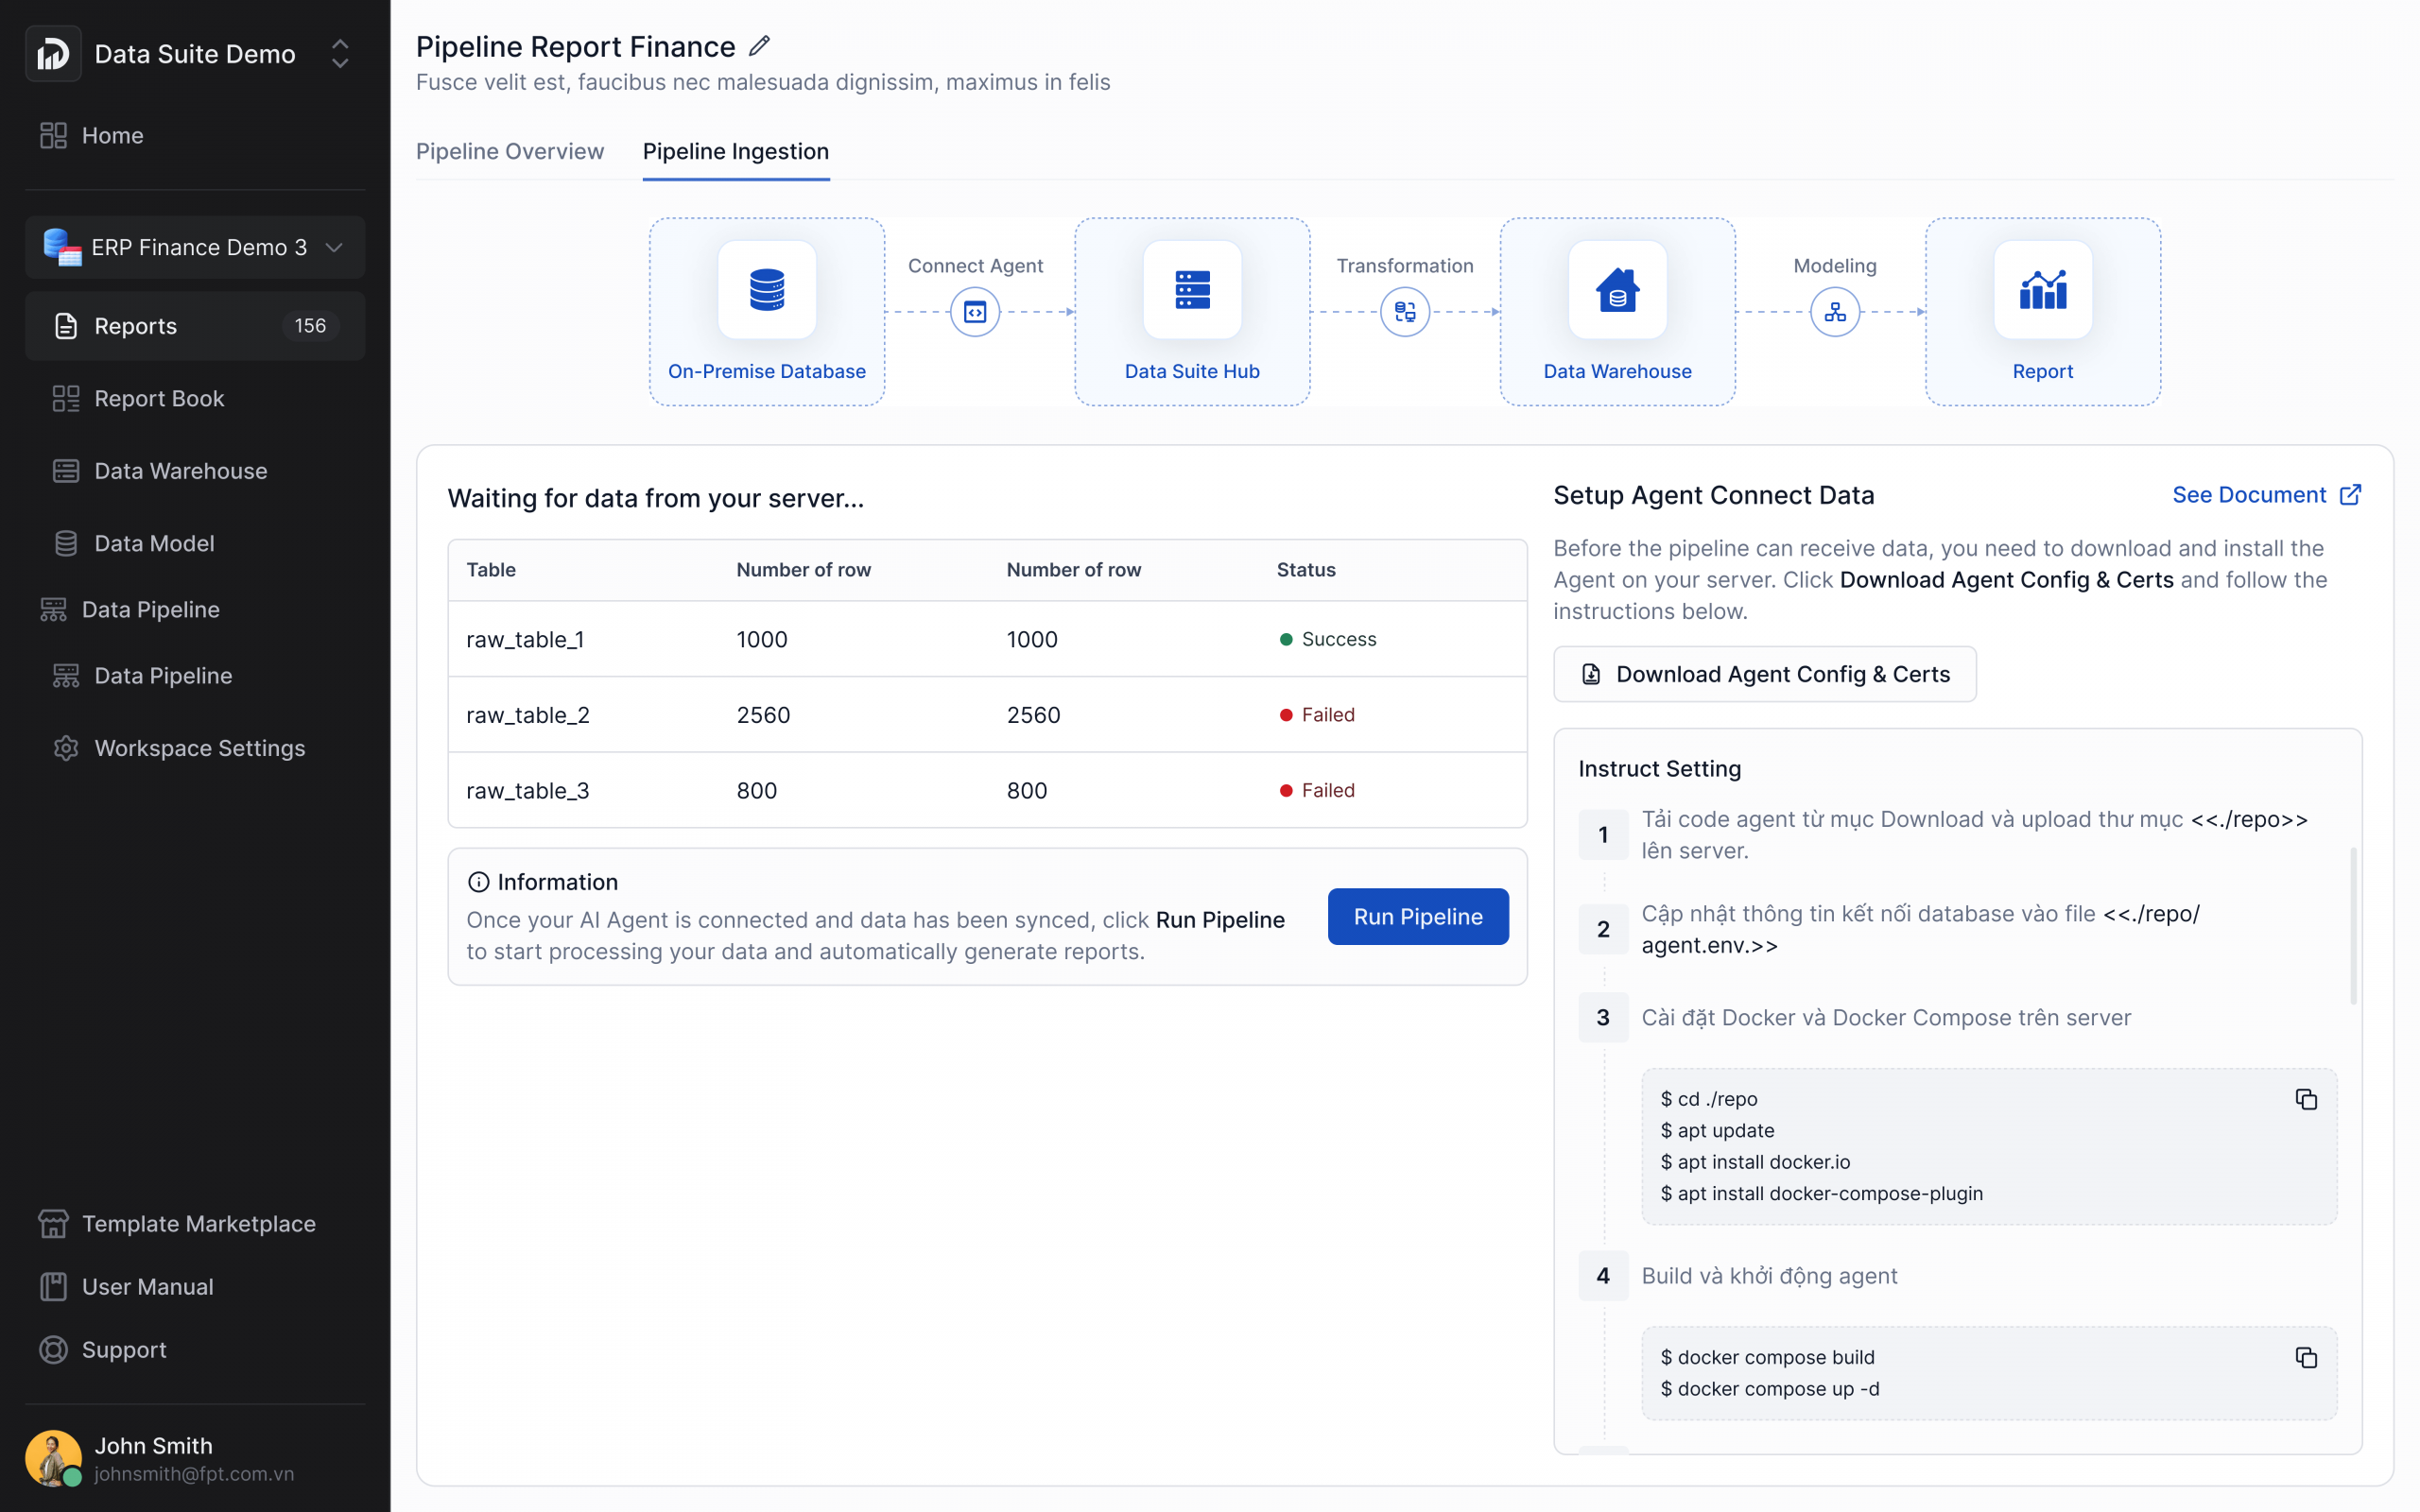
This significantly accelerates BI deployment, especially for small and medium-sized businesses that may not have dedicated Data Analysts or Data Engineers. Instead of spending days or even months building pipelines and dashboards from scratch, organizations can now complete the process in just a few hours or even minutes.
Start using Pipeline Template HERE.
3. Unlock Deeper Data Insights with Three New Chart Types
To expand data visualization capabilities and make dashboards easier to interpret, FPT Data Suite introduces three new chart types in the Q1/2026 update.
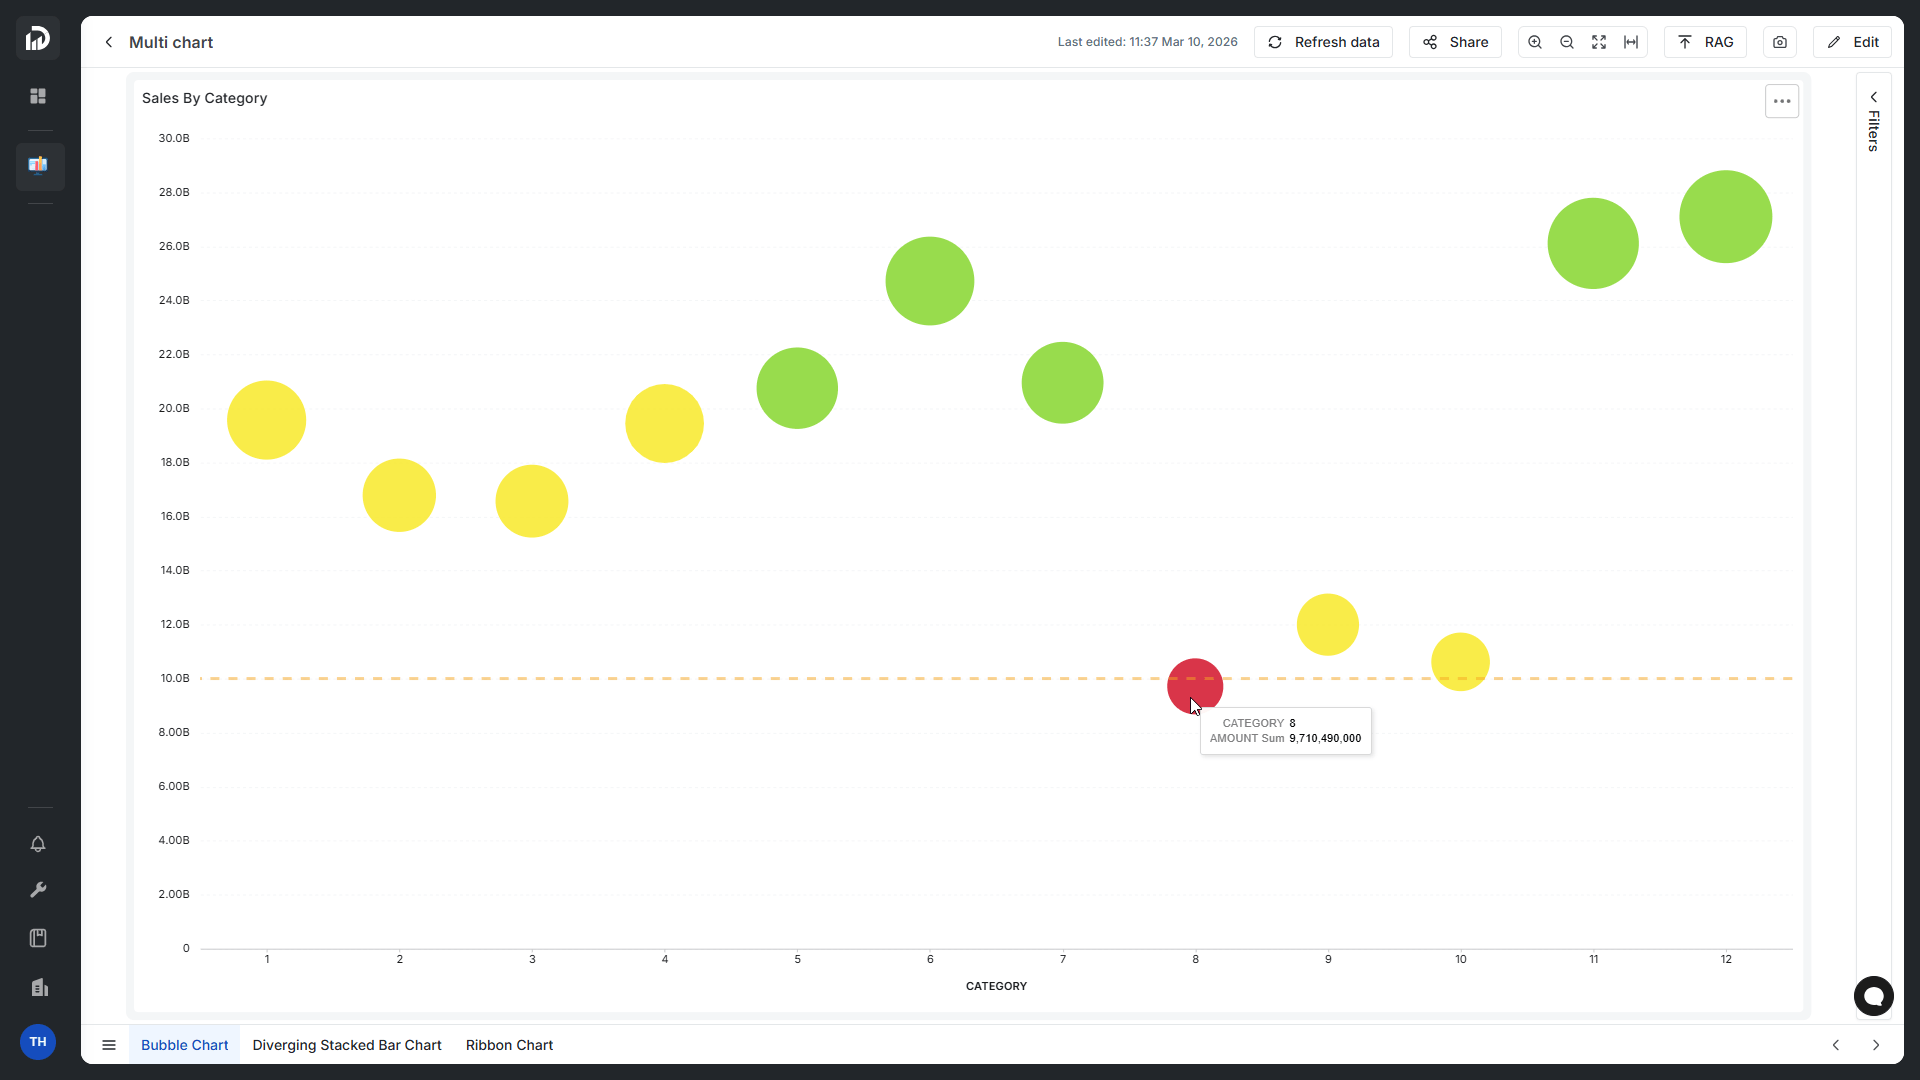
Bubble Chart
The Bubble Chart helps users quickly identify relationships and differences among multiple data groups within a single visualization. By combining position on the X and Y axes with bubble size and color, users can compare multiple metrics simultaneously.
This chart is particularly useful for scenarios such as product performance evaluation, financial analysis, and identifying high-impact data segments.
 Diverging Stacked Bar Chart
The Diverging Stacked Bar Chart allows users to easily compare groups of data that move in opposite directions within the same category, making it easier to identify differences between groups.
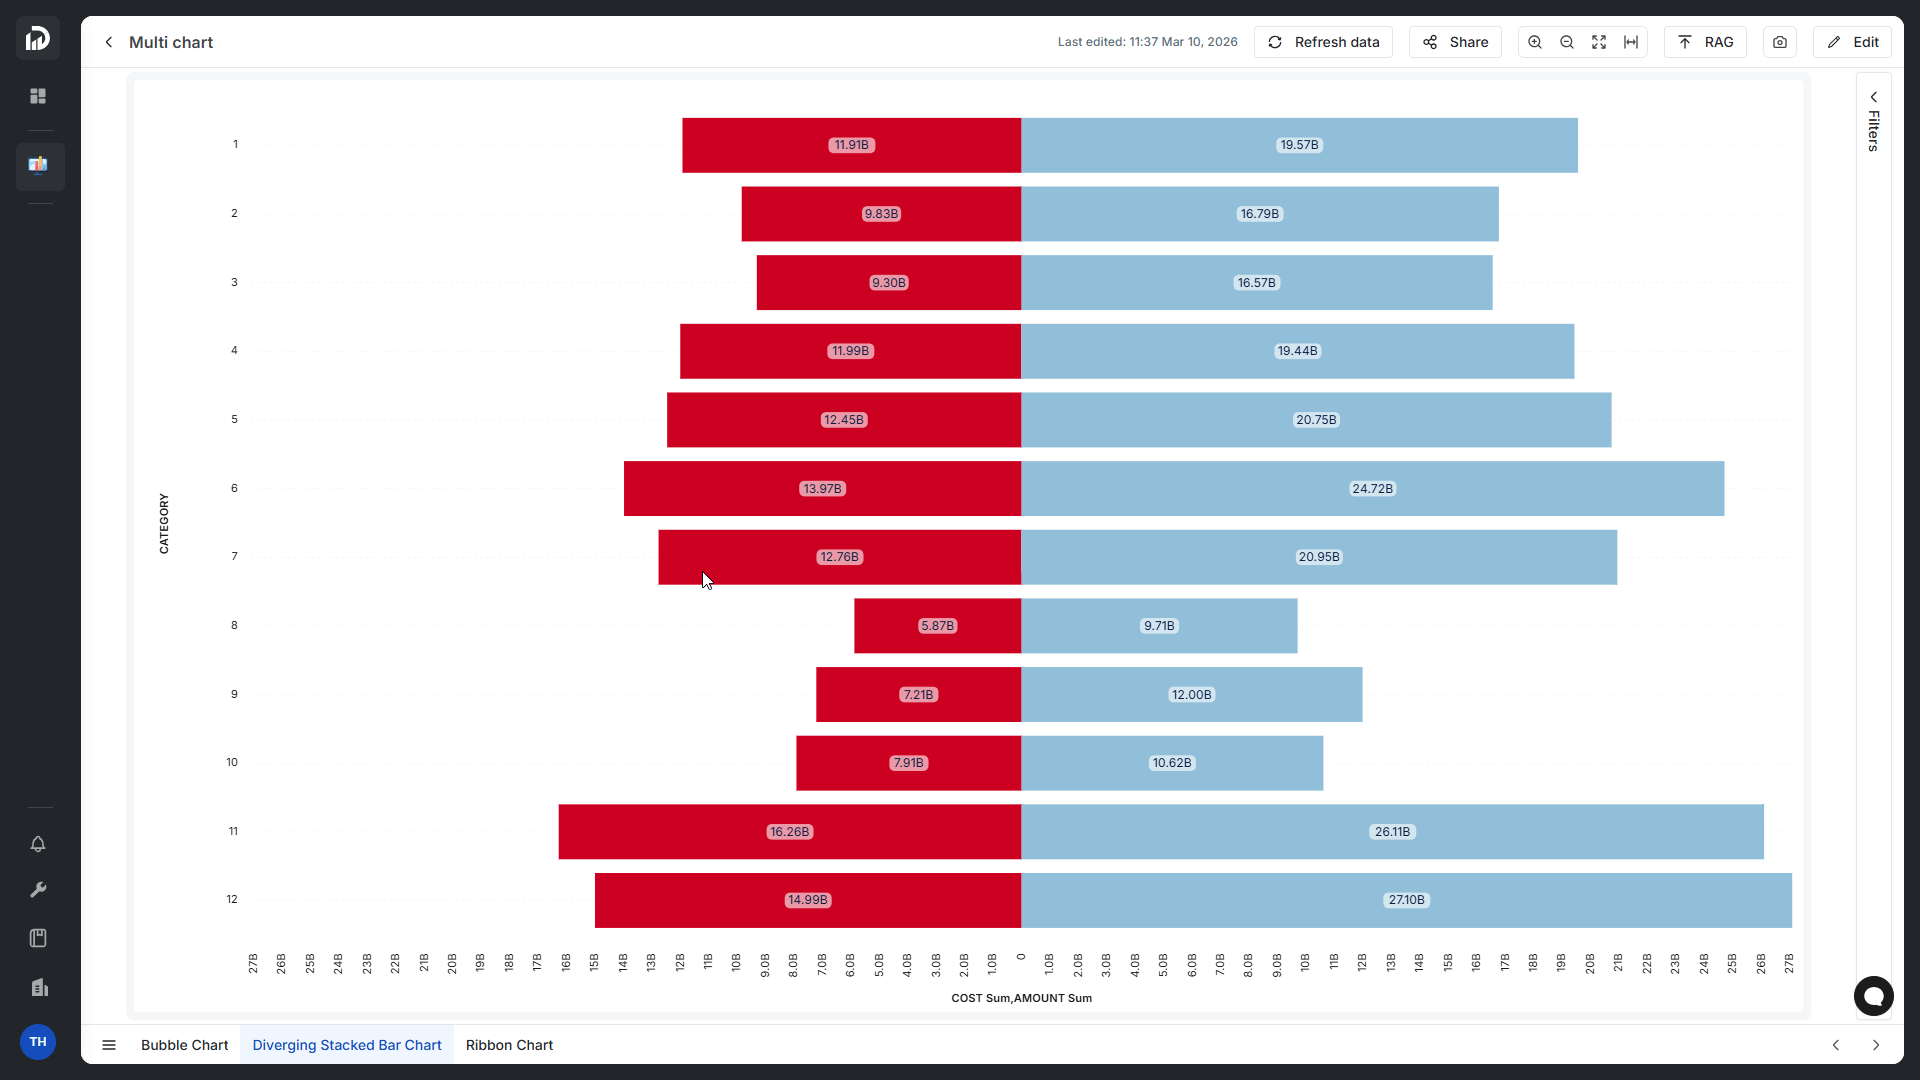 This visualization is especially effective for analyzing survey results, customer satisfaction levels, and increase–decrease indicators, enabling users to clearly see the proportion between positive and negative factors when making decisions.
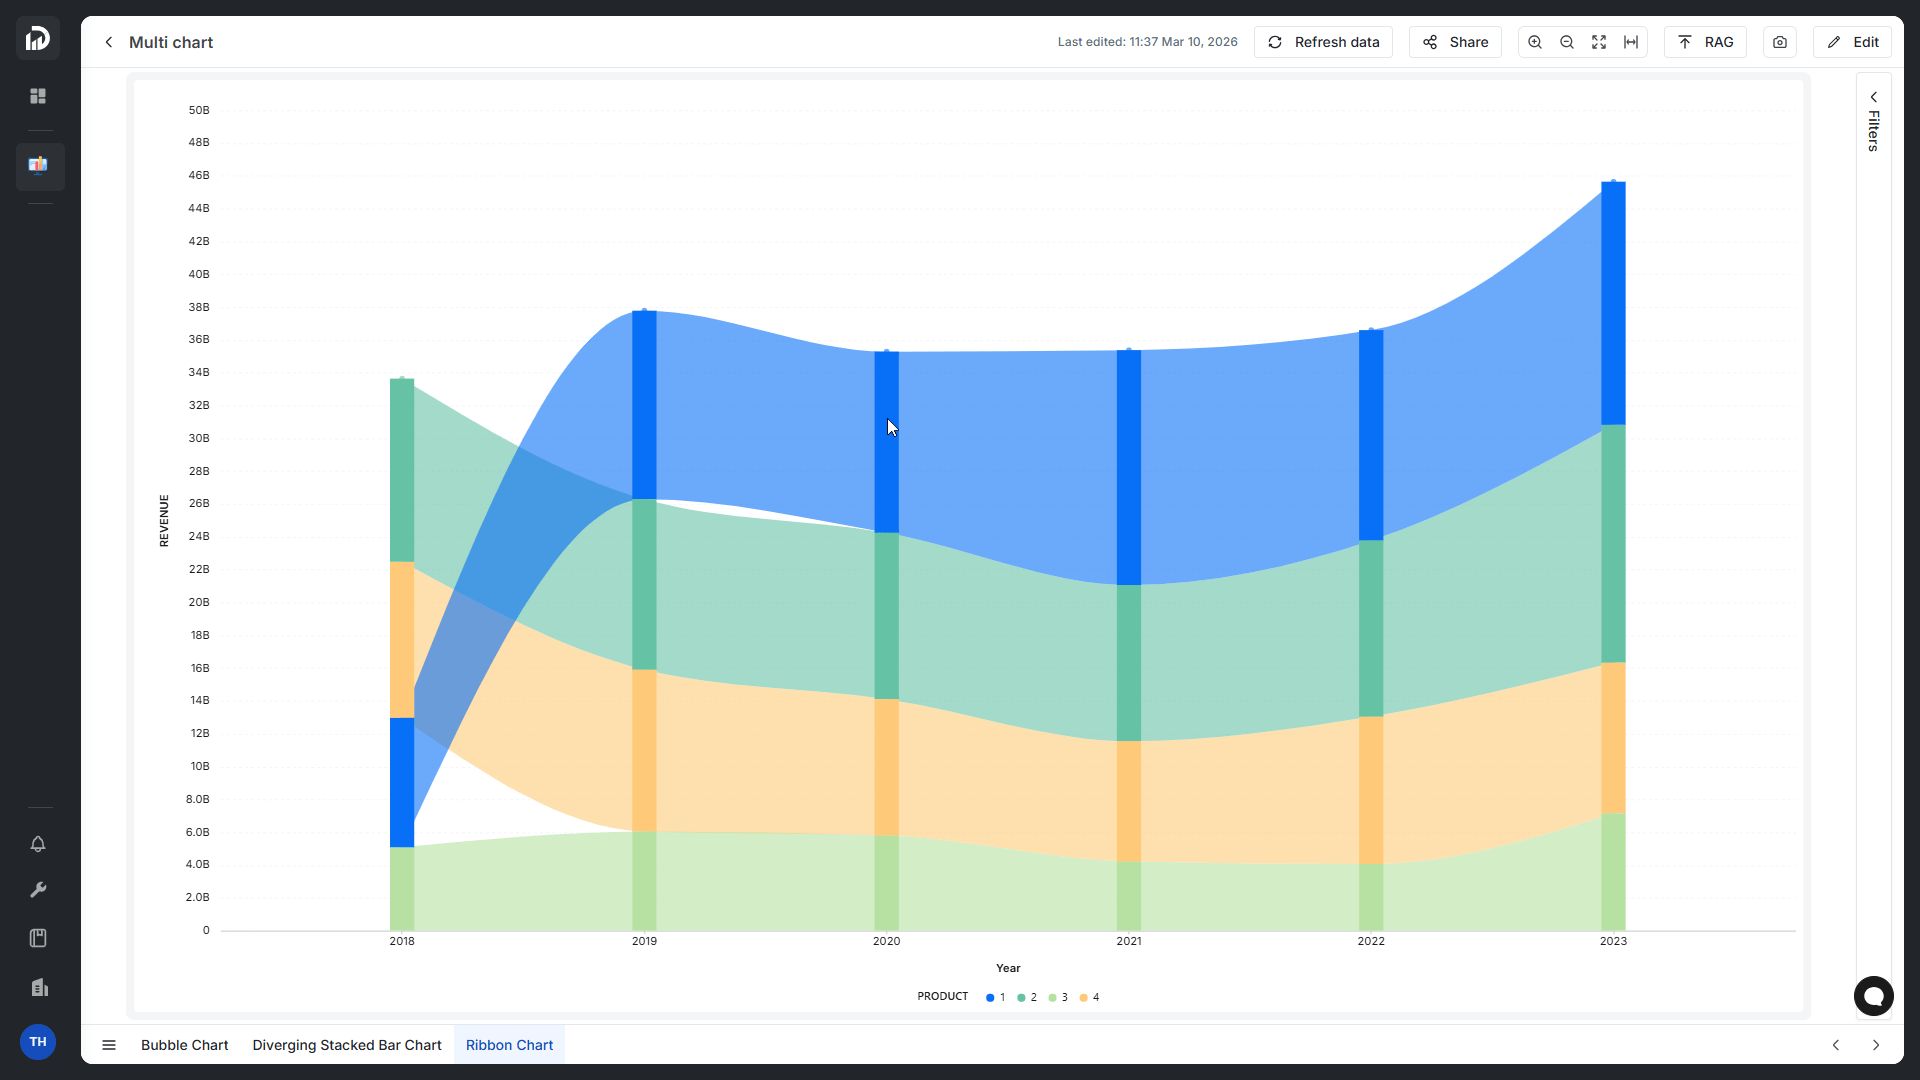
Ribbon Chart
The Ribbon Chart is designed to visualize trends over time and is particularly powerful for tracking ranking changes among categories.
It enables report readers to quickly identify which categories generate the highest revenue, how market share evolves, and how each segment compares within the overall dataset.
4. Improved Dashboard Building Experience
Alongside new features, FPT Data Suite also significantly enhances the dashboard design experience.
Undo Feature in Report Editing
Users can now revert actions while designing dashboards using the Ctrl + Z shortcut, reducing errors and saving time when experimenting with different chart configurations or layouts.
Upgraded Chart Design Interface and Data Field Handling
Several improvements make dashboard creation more flexible:
- Drag-and-drop and reorder data fields within Dimensions, Metrics, Lines, and Legends;
- Customize the position and angle of Data Labels for Column, Bar, and Line charts;
- Add Align Zeros option in Combo Charts to align value axes;
- Enable show/hide Legends in Pie Charts
These improvements make it easier for users to customize dashboards according to their visualization and analysis needs.
5. Optimized Report Viewing Experience
In addition to improving dashboard design, FPT Data Suite also introduces several enhancements to the report viewing experience.
The system now standardizes weekly date formatting according to the ISO 8601 standard, ensuring greater accuracy when analyzing reports by week or year.
The platform also introduces flexible dashboard zoom options, allowing users to view reports more conveniently across different screen sizes:
- Fit to page
- Fit to width
- Zoom in / Zoom out (up to 400%)
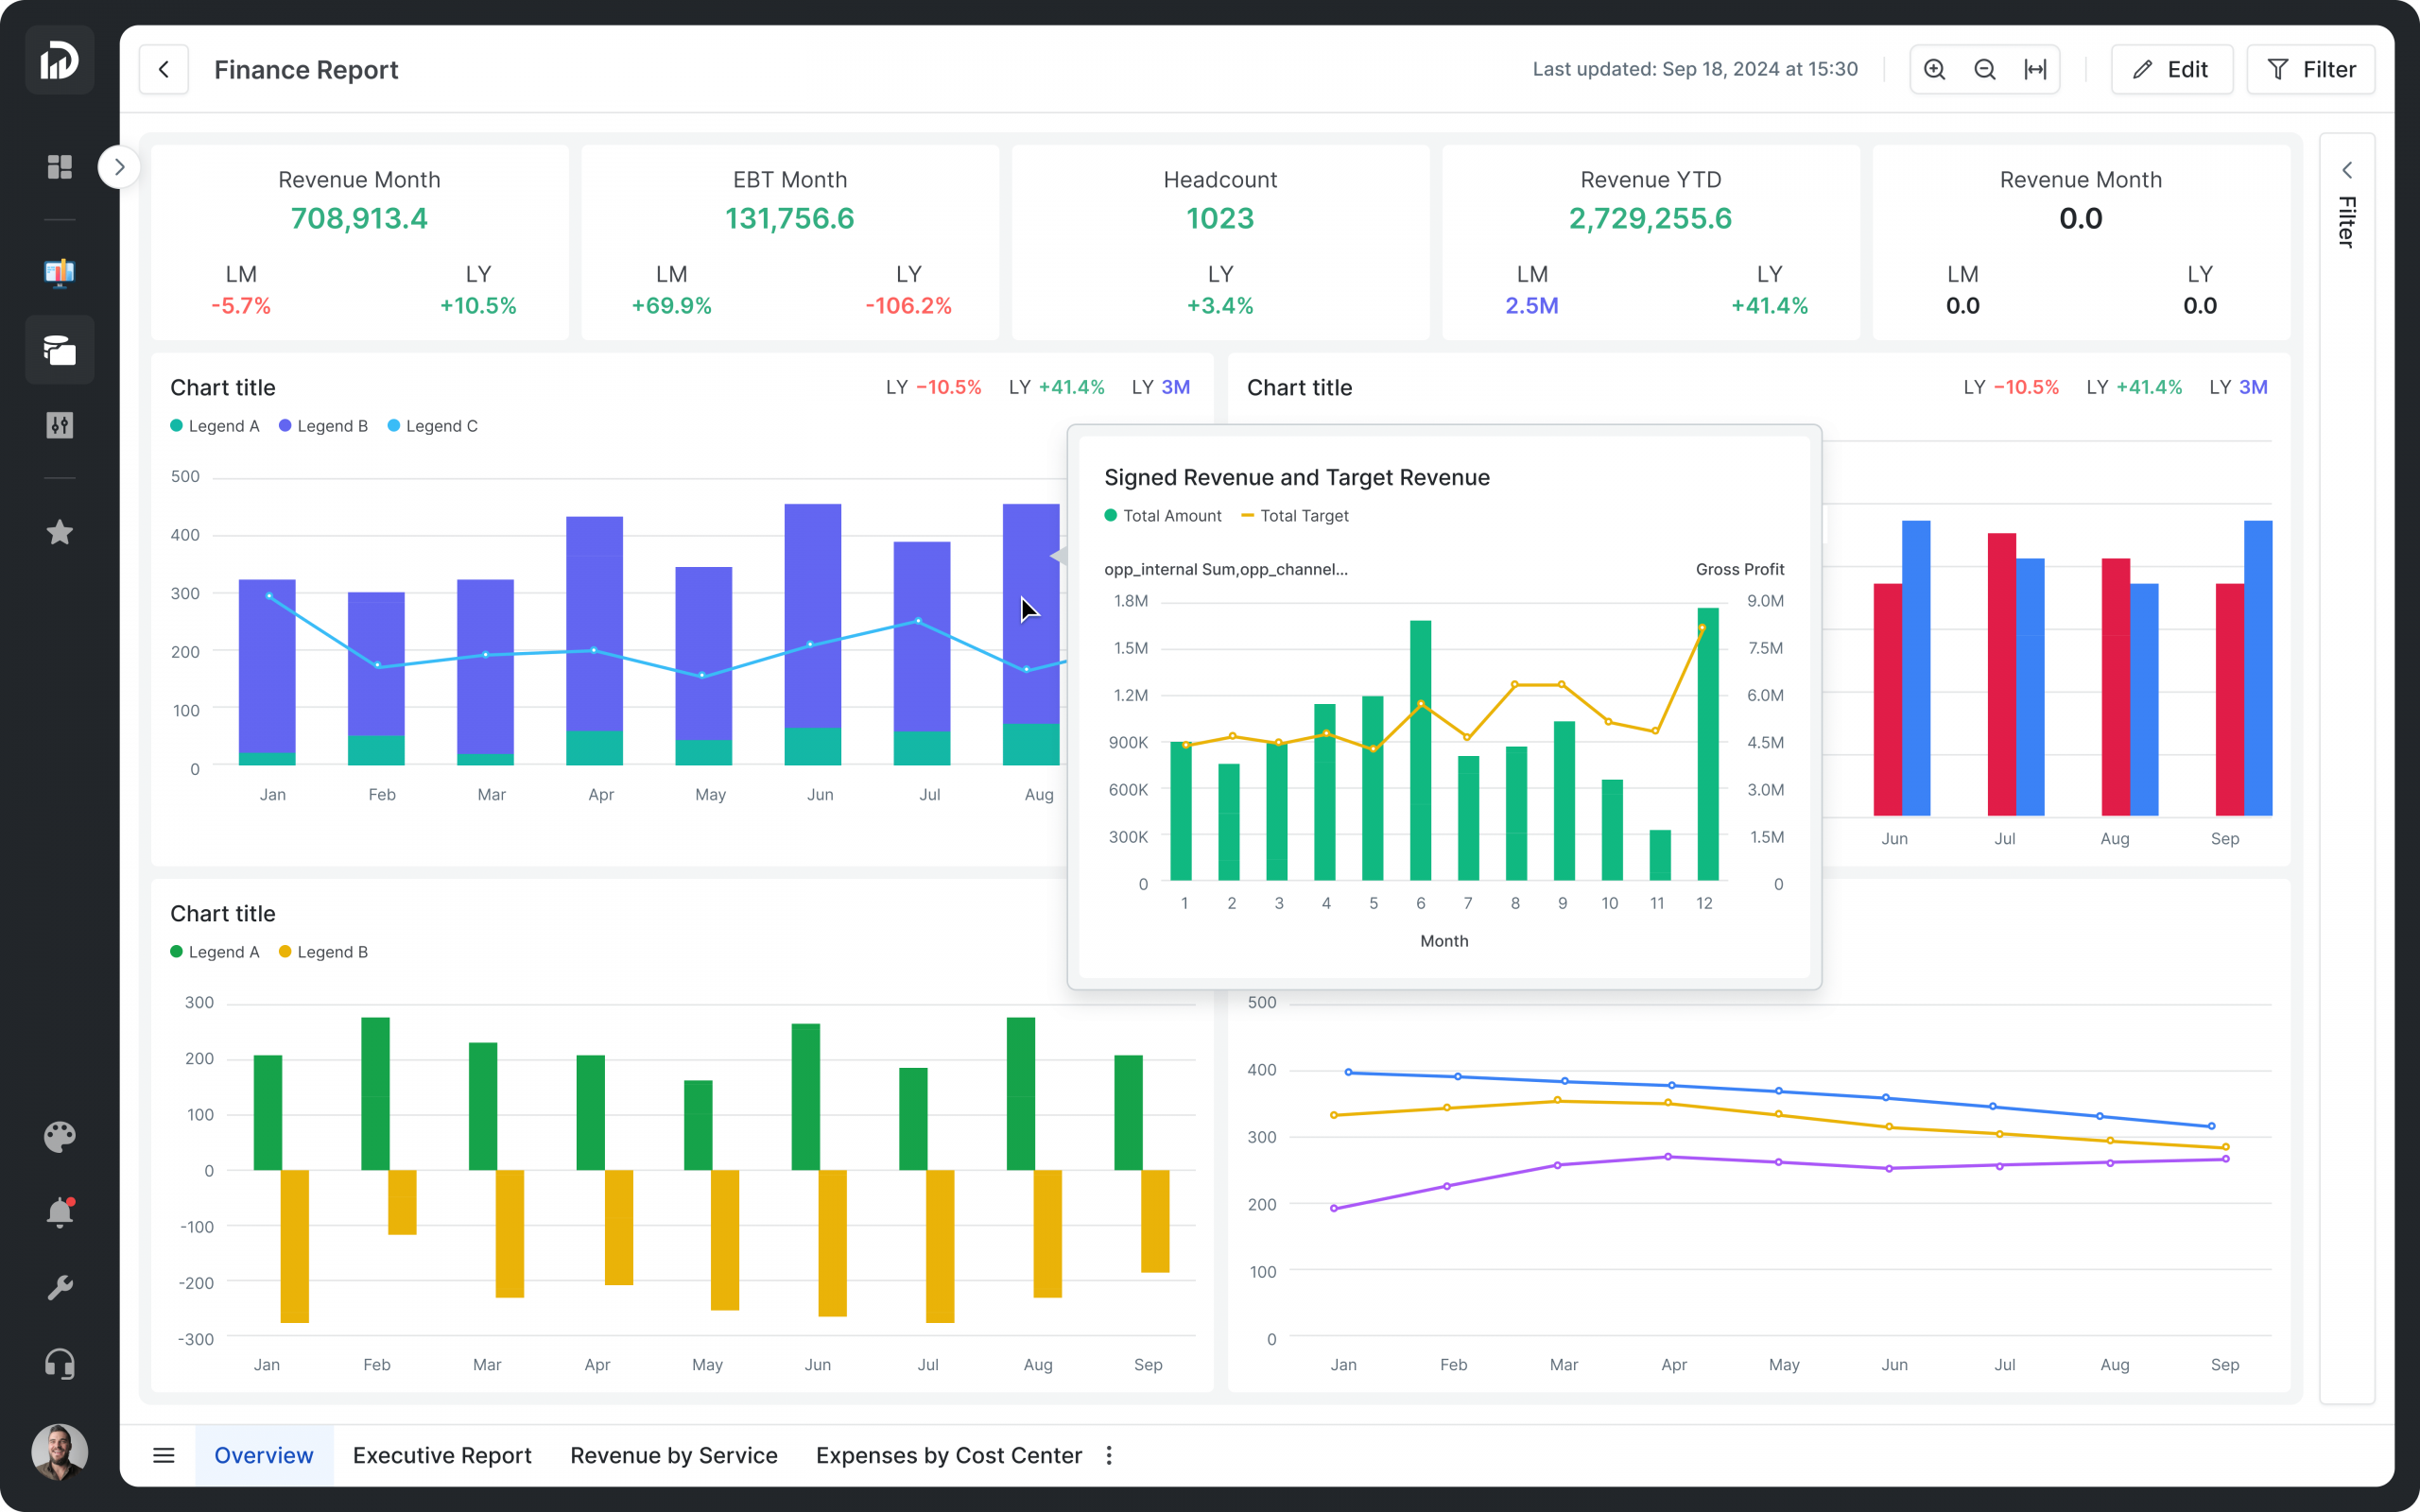
Another notable improvement is the ability to use a report page as a chart tooltip. When users hover over a chart, the system can display additional information from another report page, providing richer data context without cluttering the dashboard layout.
Additionally, the scrollbar size in Tables has been increased, making it easier to navigate large datasets.
From the introduction of Pipeline Template to UI/UX improvements, the Q1/2026 updates demonstrate how FPT Data Suite continues to simplify BI workflows – making data operations more seamless, intuitive, and scalable for enterprise environments.
For organizations seeking a platform that supports both daily data operations and advanced analytics, these enhancements further reinforce the role of FPT Data Suite as a key tool in building a data-driven business.
Try the new features now: https://fptsmartcloud.vn/Dung_mien_phi