In the data era, organizations are not short of data but they often lack the ability to transform data into actionable insights. BI (Business Intelligence) tools were created to address this challenge, enabling enterprises to analyze, visualize, and make decisions based on data. However, only by selecting the right BI tool can data truly become a sustainable competitive advantage and a driver of long-term growth.
What are BI Tools?
BI Tools (Business Intelligence Tools) are solutions that help organizations collect, process, analyze, and visualize data from multiple sources such as ERP systems, CRM platforms, accounting software, sales data, marketing data, and internal operational systems.
Instead of working with fragmented datasets or manual reports, BI tools allow users to monitor data through dashboards, charts, and real-time interactive reports. As a result, data no longer remains dormant within systems but becomes a direct foundation for business decision-making.
The role of BI Tools in enterprise operations
In fast-changing business environments, decisions driven by intuition or delayed reports can cause organizations to miss opportunities or face unnecessary risks. BI tools help enterprises to:
- Gain a holistic view of business operations on a single, unified platform
- Monitor performance in real time, from revenue and costs to departmental efficiency
- Identify trends, bottlenecks, and potential operational risks at an early stage
- When data is continuously updated and visually presented, enterprise management becomes more proactive and agile.
Benefits of choosing the right BI Tool
1. Faster and more accurate decision-making
A suitable BI tool enables executives and managers to access the right data at the right time and in the right context. Instead of waiting for manually consolidated reports, key metrics are updated instantly, allowing organizations to respond swiftly to market fluctuations.
2. Optimized operational efficiency
BI tools support in-depth performance analysis by department, product, or campaign. This allows organizations to clearly identify which activities are effective and which areas require improvement, helping optimize costs and resource allocation.
3. Multi-source data integration and elimination of “data silos”
Selecting the right BI tool allows enterprises to consolidate data from multiple systems into a single platform. With interconnected data, departments share a “single version of the truth,” minimizing discrepancies and enhancing cross-functional collaboration.
4. Ease of use for non-technical users
A strong BI tool is not limited to IT teams or data analysts—it is also accessible to business users. Intuitive interfaces and drag-and-drop reporting capabilities empower users across the organization to explore data independently without complete reliance on technical teams.
5. A foundation for data-driven and AI strategies
BI tools do not only serve current reporting needs; they also act as a stepping stone toward advanced analytics, AI initiatives, and predictive modeling. Once data is standardized and effectively analyzed, organizations are well-positioned to tackle more complex data challenges.
Most popular BI Tools today
Tableau
Tableau is one of the most prominent BI tools, renowned for its powerful analytics and data visualization capabilities. The platform enables users to easily build interactive dashboards and reports across multiple devices, from desktops to mobile devices. Tableau supports connectivity to a wide range of data sources, including relational databases, NoSQL systems, and Big Data platforms. However, it has limitations in handling complex SQL queries and typically requires relatively high investment costs.
Power BI
Microsoft Power BI is widely adopted thanks to its strong data connectivity across databases, CRM, ERP systems, and cloud services. Power BI supports the creation of interactive reports, charts, and dashboards suitable for both operational analysis and executive management. Nevertheless, the free version is limited in terms of access control and large-scale data processing.
Qlik
Qlik offers a self-service BI platform with flexible deployment options across cloud and on-premises environments. Its key strength lies in associative data technology, allowing users to explore and analyze data from multiple perspectives without complex data modeling.
In addition, its drag-and-drop interface enables non-technical users to build reports relatively easily. However, Qlik is less robust in map-based visualizations and may present a learning curve for new users.
Google Data Studio
Google Data Studio is a free BI tool that enables quick creation of interactive dashboards and reports. With deep integration into the Google ecosystem—such as Google Analytics, Google Ads, and BigQuery—it is particularly well-suited for marketing teams and digital analytics use cases. That said, its customization, scalability, and ability to handle complex data processing are limited compared to more advanced BI platforms.
SAP BusinessObjects
SAP BusinessObjects is a BI suite designed for large enterprises, supporting organization-wide data analysis and reporting. The platform focuses on enabling business users to access reports and analytics without requiring deep technical expertise.
One of its advantages is seamless integration with Microsoft Office, allowing users to move flexibly between familiar tools such as Excel and BI systems. However, deployment and operation often demand significant infrastructure and resource investment.
Sisense
Sisense stands out for its high processing speed and flexible integration with various third-party applications such as Google Ads, Excel, Zendesk, and Salesforce. The platform is designed to deliver rapid insights, enabling near real-time answers to data-driven questions.
That said, Sisense’s visualization and reporting customization capabilities remain relatively basic, and its access management and team collaboration features have certain limitations.
Grow.com
Grow.com is a flexible BI platform with strong connectivity to sales, marketing, and e-commerce systems such as Salesforce, Google Analytics, WooCommerce, and Shopify. It is well-suited for organizations that want to track key business metrics such as sales performance, pipelines, and revenue forecasts.
With pre-built dashboard templates, Grow.com allows BI newcomers to get started quickly. However, users still need time to fully leverage the platform’s capabilities.
Audiense
Audiense is a specialized BI tool focused on social media analytics, particularly Twitter. The platform helps organizations analyze audience behavior, interests, and demographics to optimize communication and marketing strategies.
Given its focus on social data, Audiense is more suitable for specialized marketing teams rather than comprehensive enterprise-wide data analytics needs.
FPT Data Suite – A BI & Analytics platform for Vietnamese enterprises
Alongside international BI tools, FPT Data Suite is a comprehensive BI and data analytics platform developed by FPT Smart Cloud, tailored to the practical needs of Vietnamese enterprises transitioning toward data-driven operating models.
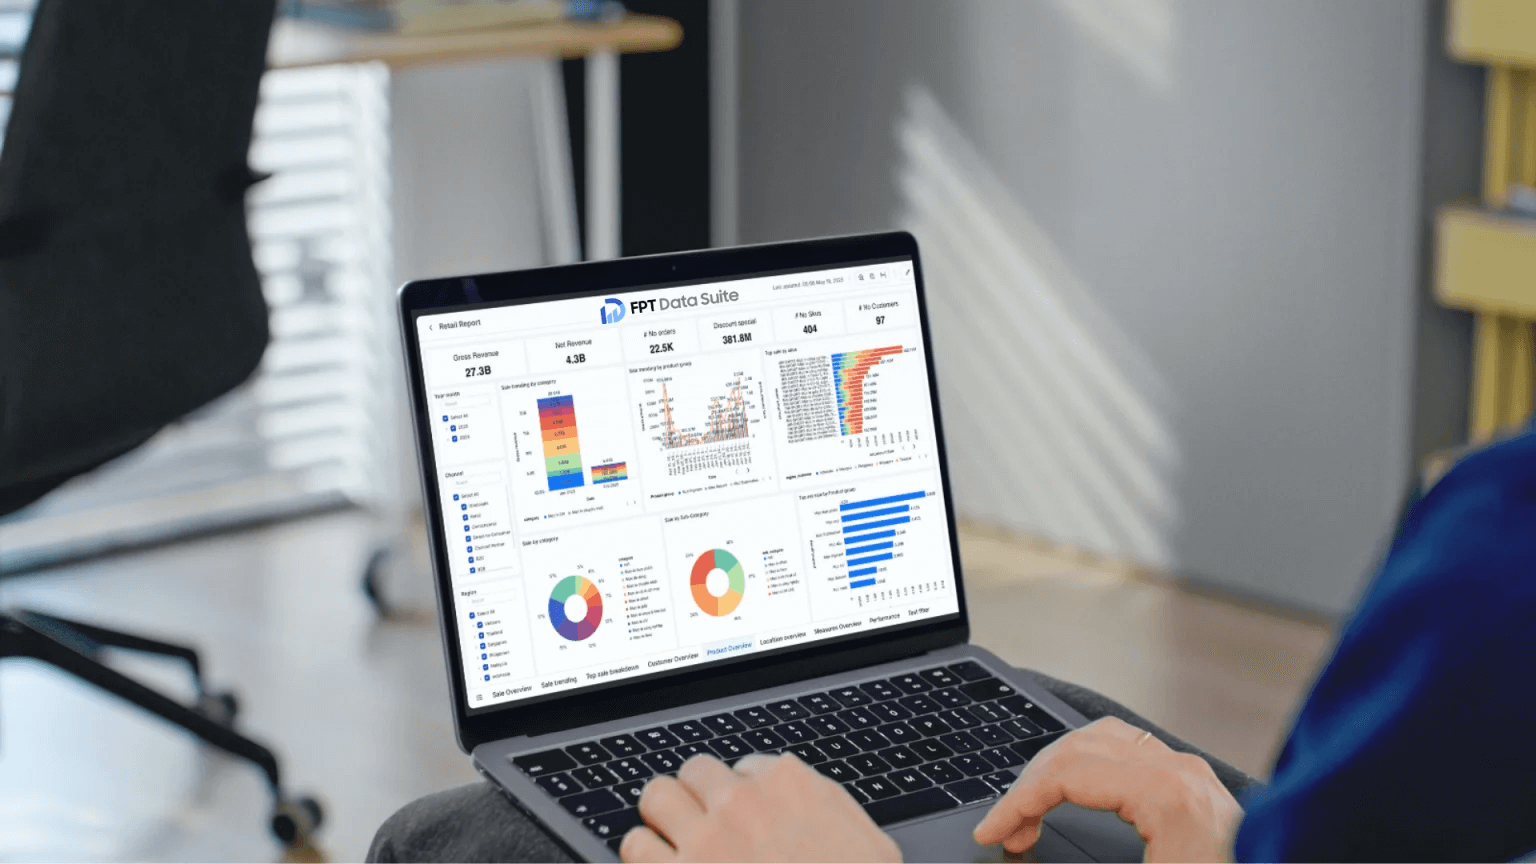
FPT Data Suite enables organizations to connect and consolidate data from multiple systems, build intuitive dashboards for different departments, monitor operational metrics in real time, and scale flexibly as the business grows. The platform is designed to be user-friendly for business users while still meeting requirements for data governance, access control, and security.
Experience the FPT Data Suite platform with its intuitive drag-and-drop model here: https://www.datasuite.vn/